Well apart from one session out at the scope in early September, the weather these last seven weeks has been dire. I’ve got to go back to December of last year when I was only able to get out once during a month. November looks as though it’s going to be even worse, with not one clear night so far. While we have had lots of clear skies during the day, the relatively high Autumnal temperatures just seems to encourage the formation of fog which rolls in early evening, where it sits all night. While I’m getting a little fed up with this situation, my time has not been wasted.
The Radio Astronomy side and in particular, Meteor scatter detection, is coming along in leaps and bounds. My last blog entry suggested that as I wasn’t able to get Spectrum Lab to work with the FCD ( Fun Cube Dongle) receiver and that I had settled on using SDR Radio v 2.0 as the software of choice. While I still think this software has it’s place, nearly all the meteor scatter peeps are using Spectrum Lab, so it seemed worth persevering with. I’m therefore glad to report that I’ve had a modicum of success.
The biggest hurdle seemed to be to get the FCD to talk to the software. It wasn’t till I carefully read Paul Hyde’s article in issue One of the BAA Radio Group’s Magazine , that I realised that SL ( Spectrum Lab) doesn’t control the frequency of the FCD directly. One has to set this using the FCHID 2.oo software that comes with the Dongle. Once I started to get data, the next problem was to find a script that would look at meteor peak readings and record these in a text file. That way I didn’t have to go through the recorded sound files and log the meteor hits manually – a task that is less interesting that watching paint dry.
It’s at this point that I would like to thank Paul Hyde of the BAA’s Radio Group for all this help. Apart from lot of encouragment generally, he forwarded a couple of SL configuration files, one of which included a script that logs all the meteor hits over a user set level. As well as logging this data, the script also saves a graphical snapshot of the waterfall plot of the meteor echoes as they happen. This allows me to run the whole caboodle 24/7 and just extract the data into Excel.
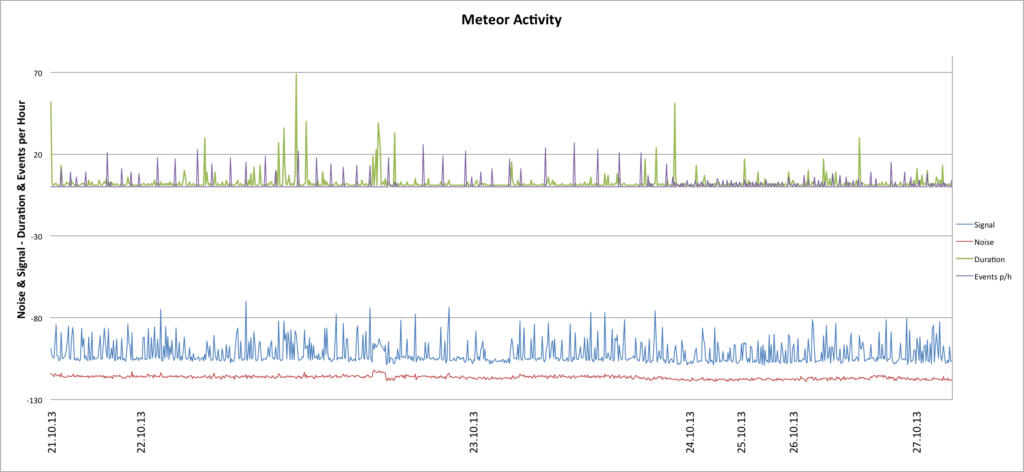
I wanted to get all this up and running for the Orionids peak on 21, October, but missed most of the peak but from 03:30 GMT that day until midnight on Sunday the 27th, I was able to plot the data on the graph below.

The SL script is just logging meteors that produce a signal that is 17 dB’s above the background level. Therefore during periods of high meteor activity, there are going to be more readings. The graph reflects this, so you can see there is more data between Midnight on the 22nd and the 23rd than the subsequent 24 hours periods after that. The background noise is the red plot and the meteor power readings are the light blue plot. The script also logs the duration of the meteor trails and these are the Green plot. The highest peak at 70 equates to a duration of ionisation activity of about 23 seconds. The final Purple plot is an hourly count of readings above this 17 dB level. The one thing this graph does not display well, is the timing of the shower peak during a 24 hour period, although it seems to show that there was a lot of activity.
It is possible to run two instances of SL at the same time, so I think the trick to hour by hour counts, is to run a script on the second instance of SL, that will log all meteor hits, not just the larger ones above 17dB. When using SDR, even in periods of relatively low activity, I’ve counted hit rates of anything between 20 to 30 hits an hour.

There is a plotter function in SL that will produce a graphical output of meteor hit activity – as in the image above, as well as saving these readings to a text file every second. This might solve the hits per hour problem, but as you can imagine 86,400 entries a day, is going to kill Excel if I try and graph this amount of data. I’m trying to design a macro that will go through 100,000 lines and extract how many hits occur each hour, so watch this space.
Below are a few screen grabs of some of the more interesting measurements taken over that week. But first a few explanations of what these Waterfall charts are telling us.
LOS = Line of Sight = This is an imaginary straight line drawn between the Radar transmitter in Graves and my antenna here in Cornwall. By measuring changes in frequency, we can tell how fast the meteor is travelling as it rapidly decelerates as it hits our atmosphere AND if it is traveling towards ( Blue Shifted – Increasing Frequency) or away from ( red shifted – decreasing frequency) us along the LOS.
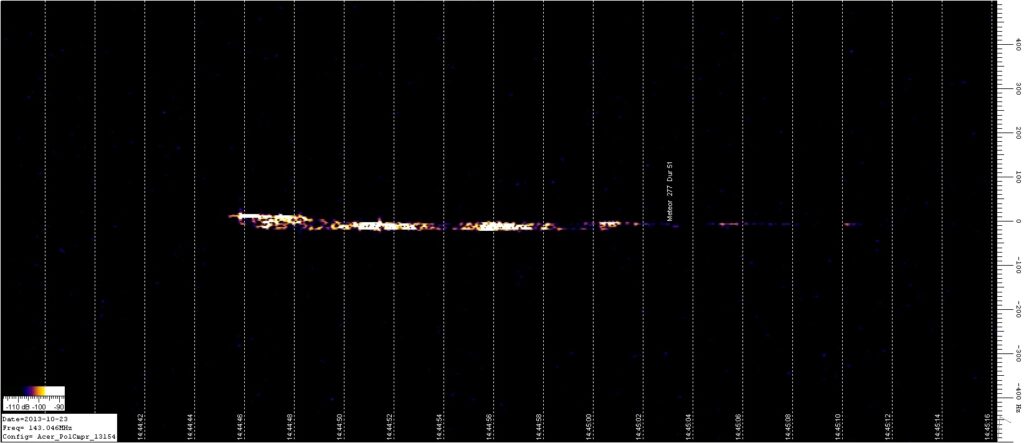
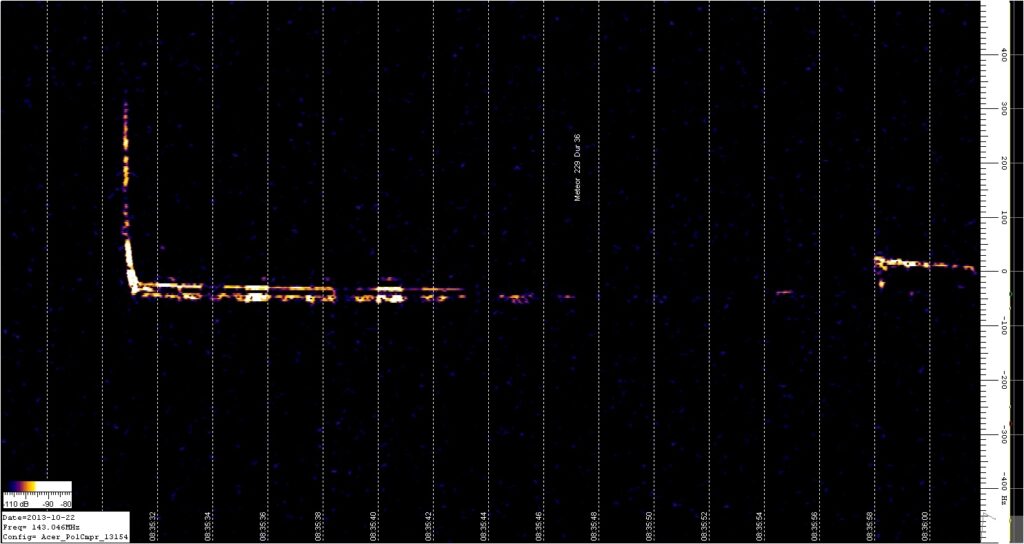
The waterfall chart is measuring two things. Frequency is marked on the vertical Y Axis and is measured in Hz. To help differentiate between a meteor that is measured as coming towards or away from me – the observer – the scale is calibrated as a positive or negative frequency centred on a reading of zero Hertz. So if a reading is above the Zero Hertz line, the meteor is traveling away along the LOS and visa-versa. Any reading that runs along that 0Hz line, is stationary along our LOS.

A prolonged ionised trail lasting for 24 seconds. The trail is running along the 0Hz line and is therefore stationary at the time of the measurement.

In contrast to the one above, The trail entering the plot from the top and stopping along the 0Hz line at 08:35:31 indicates that at that time the meteor is rapidly decelerating over a few 10th of a second and is travelling away from us, along the LOS. The change in frequency is measured at 310Hz. if we apply this to the following formula.
V= (Δf/F) x C
Where
The speed of the meteor at the time of measurement – V
Change in Frequency – Δf = 310Hz
Transmission Frequency – F = 143050000 Hz
The Speed of light -C = 299792458 m/s
So in this example V = 325.0 m/s or 11.7 Km/s
That’s quite slow, as the maximum could be anything up to 72Km/s
I’m now quite happy with the progress being made, so the next challenge is to find a way of graphing the data taken from the plotter output and get all that ready for the next big meteor shower, which will be the Geminids in mid December. My only current wish is that the weather would improve so I get get some eyeball observing done.